Using the Management UI
This guide introduces the Management UI of EventSourcingDB. The UI provides a convenient way to monitor the system state and query events without writing code.
Overview#
The Management UI consists of two main views:
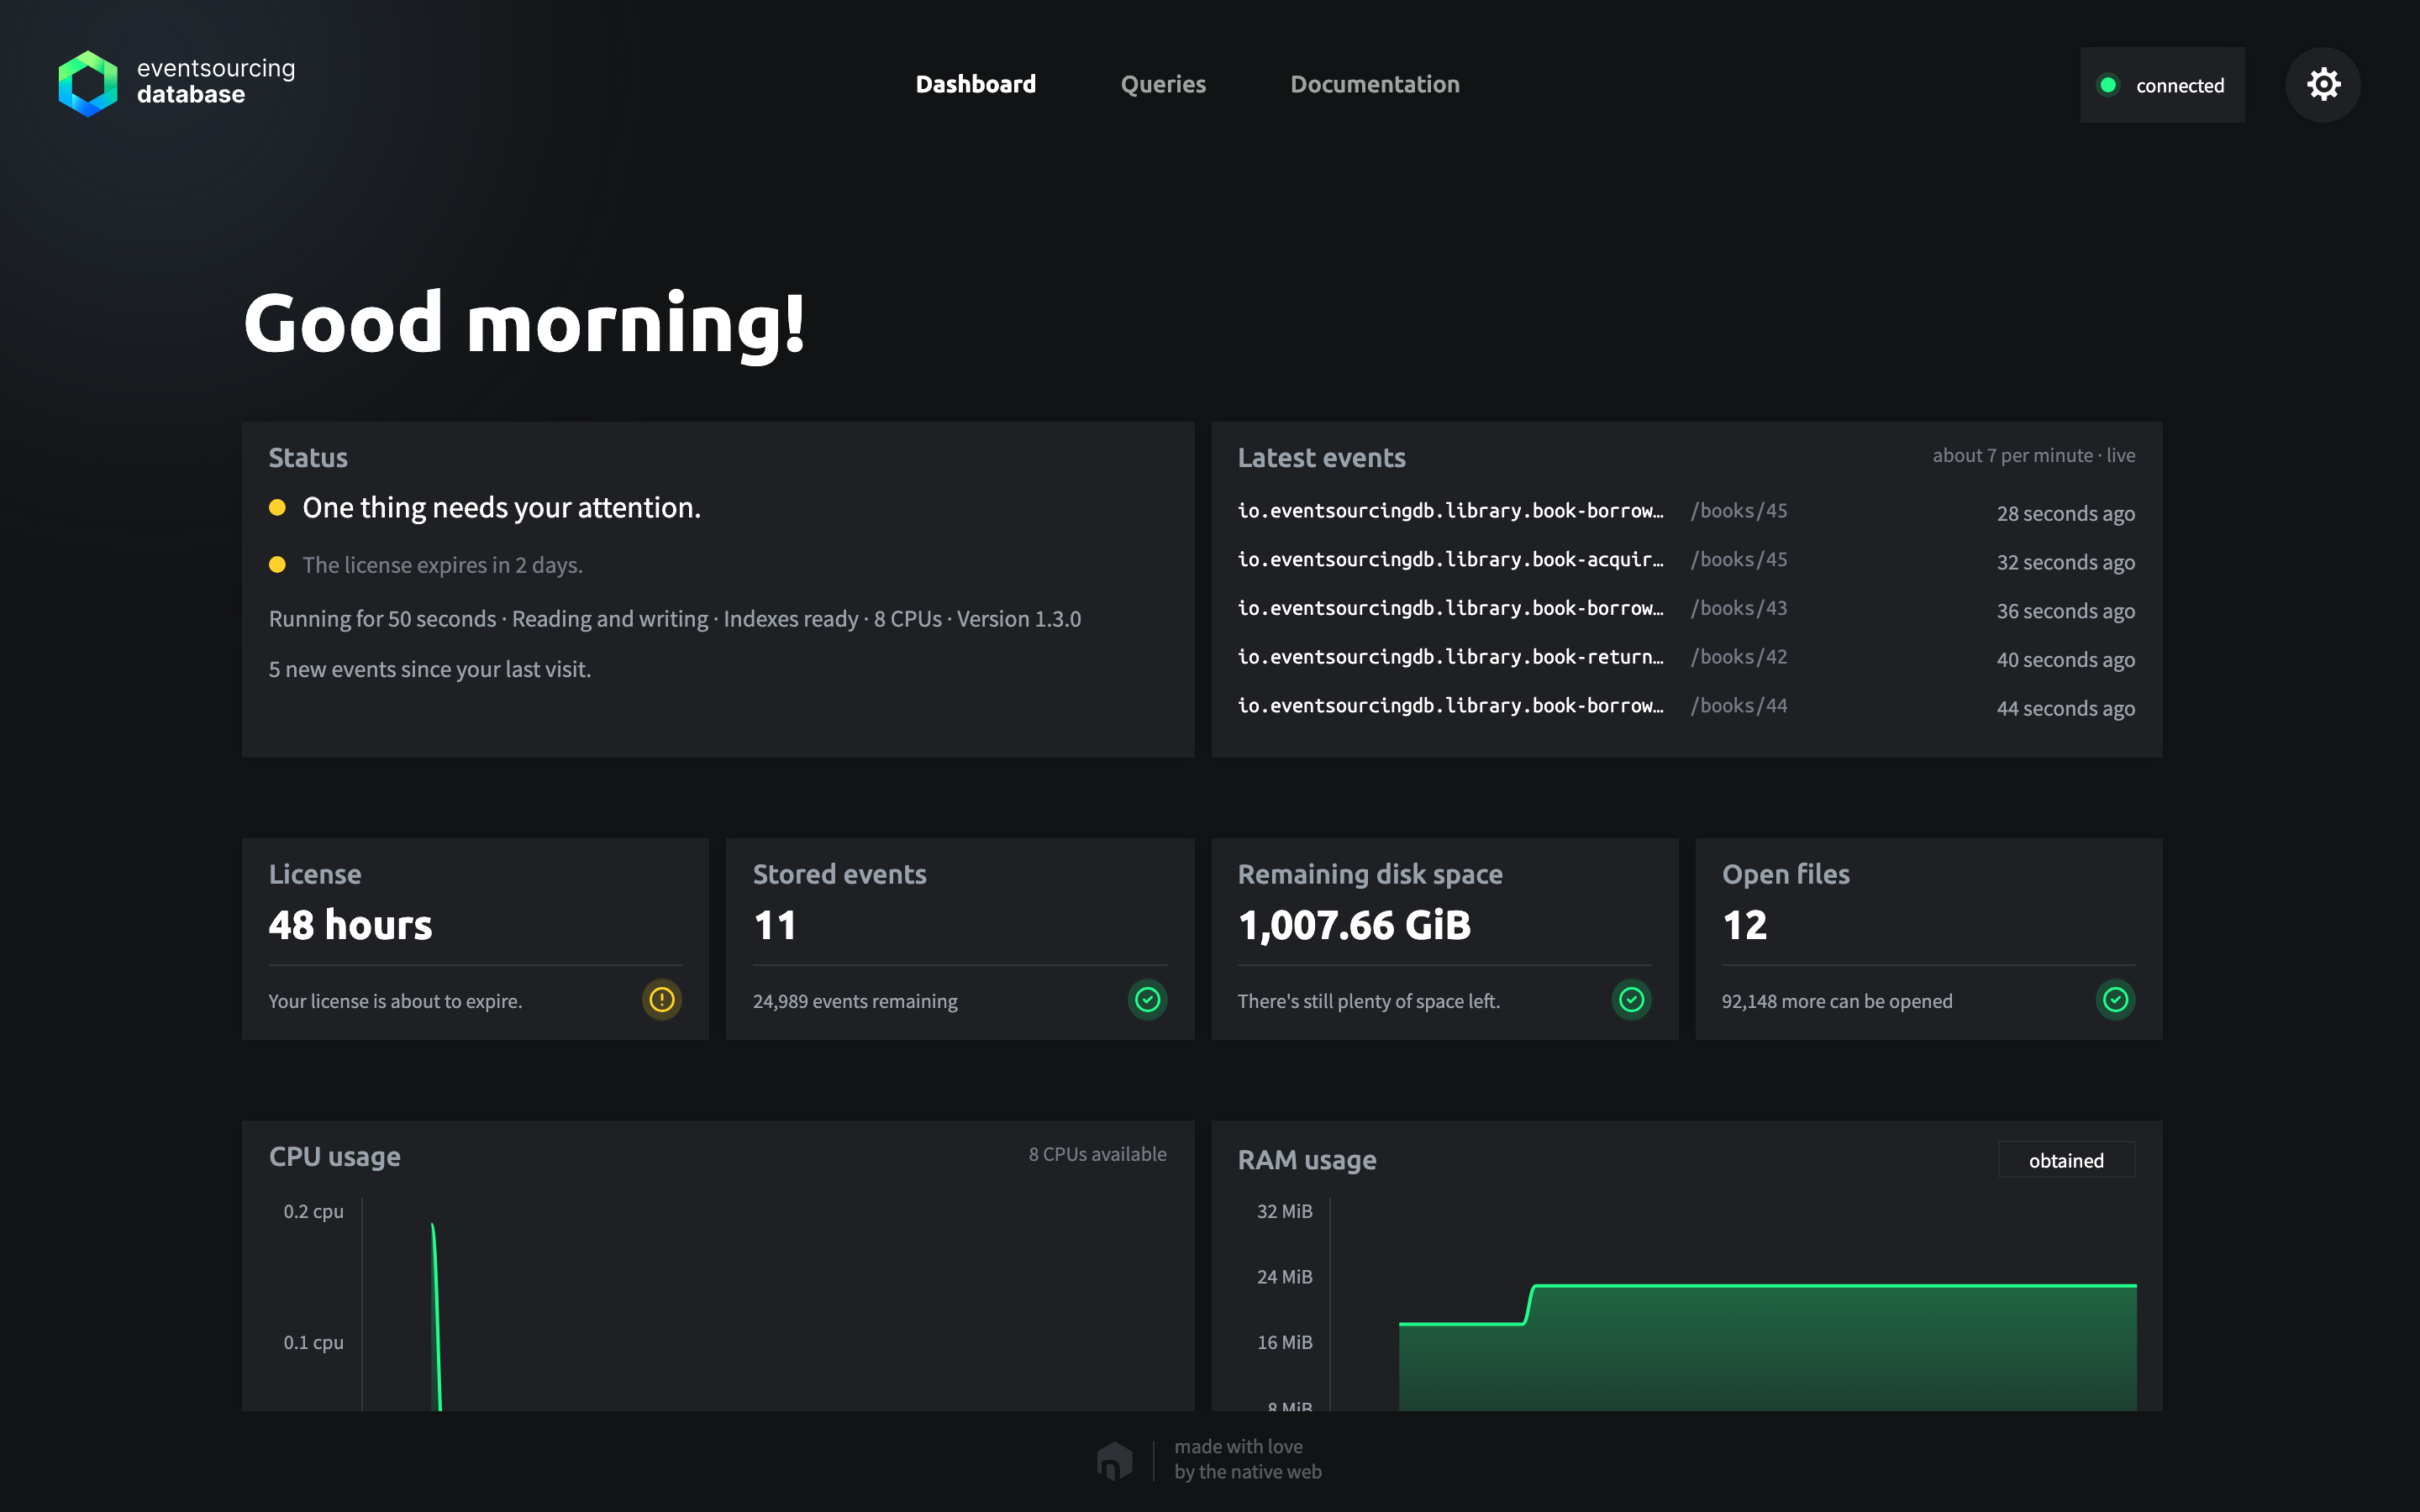
- Changed in 1.3A Dashboard that shows how the database is doing, with everything that needs attention, the latest events as they are written, and key figures and graphs of the license, the stored events, the remaining disk space, the open files, memory usage, and other operational metrics.
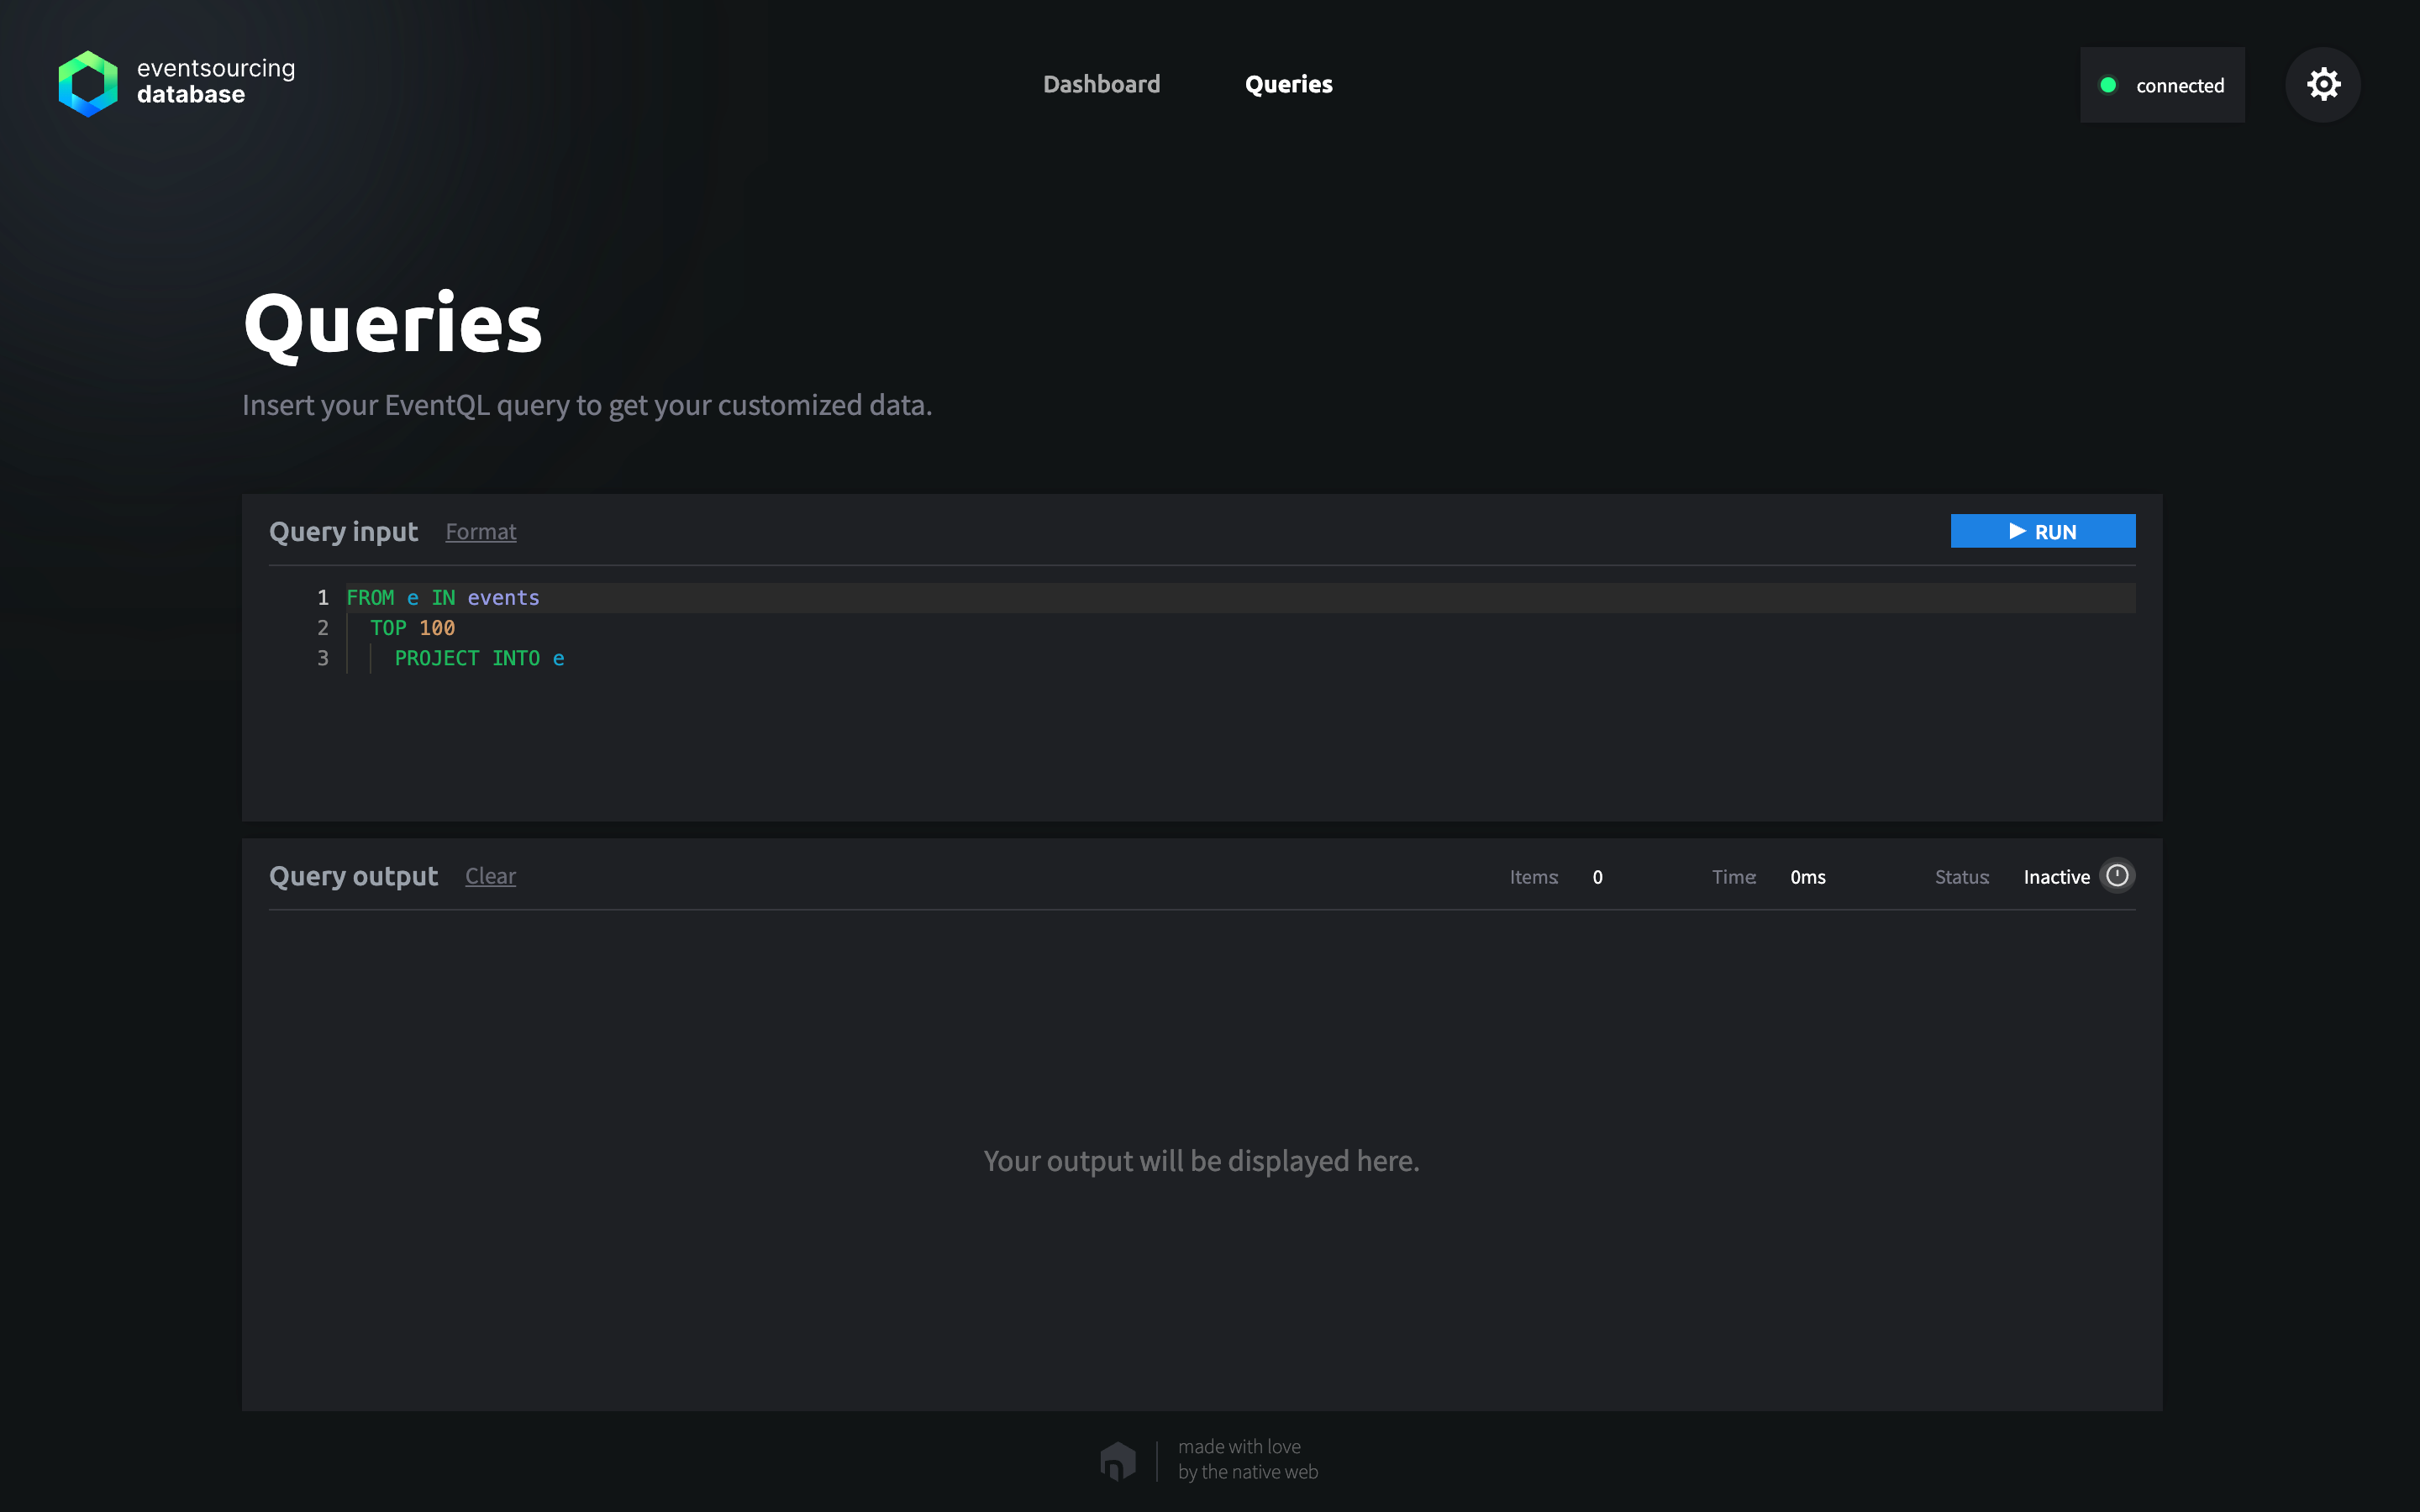
- An EventQL Query Editor that allows you to write and execute EventQL queries with a familiar developer experience, including syntax highlighting, auto-completion, error checking, and real-time feedback.
Accessing the Management UI#
Changed in 1.3The Management UI is available only when EventSourcingDB is started with the --with-ui CLI flag. To see anything of the database, log in with the API token configured for the database. Only the settings, which hold the language and the theme of the UI, open without logging in.
Once the database refuses the API token during a session, for example after it was restarted with another token, the UI ends the session and shows the login again. Logging out loads the UI anew on the login page as well, so that going back in the browser does not show what the session read to whoever uses the browser next.
The UI speaks English and German and follows the language of the browser, unless you choose one in its settings. A language chosen in version 1.2 or earlier has to be chosen once more after the upgrade.
The UI is served with security headers, among them a Content-Security-Policy under which it runs no scripts from elsewhere and cannot be shown in a frame, as well as X-Frame-Options: DENY, X-Content-Type-Options: nosniff, and Referrer-Policy: no-referrer. So it cannot be embedded in another page, such as the panel of a dashboard or a portal, and a proxy that injects scripts into its pages breaks it.
A browser checks with the server whether the files of the UI are still current whenever it loads them, so that it runs the version the server ships. On the upgrade to version 1.3, though, a browser that holds the files of an earlier version keeps running it for up to a day, unless you reload the UI bypassing the cache, see First Start After Upgrading.
Security Notice
The Management UI is intended only for development and debugging purposes. It should never be exposed to the public internet.
Dashboard View#
Changed in 1.3The dashboard provides a visual overview of the database status. A status tile sums up how the database is doing and names everything that needs attention, and next to it, the latest events appear live as they are written, the newest first. Below them, the key figures show the license, the stored events, the remaining disk space, and, except on Windows, the open files, followed by graphs of the CPU and RAM usage and of the store size. Two more tiles show the average and the maximum of the event data size and of the write time over the last minute, where the maximum write time is the longest single write, however many events it held. Apart from the latest events and the version, everything comes from the health endpoint.
For additional details, see Logging and Monitoring.
EventQL View#
The EventQL editor enables you to write and execute queries directly against the event store.
For more information, see Running EventQL Queries.